It’s only January 1st and we’re already talking about how Orange & Black Soccercast will continue to be the first and only show dedicated to Orange County Soccer Club in 2025.
That’s right fans, it’s Producer Andy and it’s Wednesday. If you haven’t figured it out already, not only do I do all the background work for the live show, I also run most of the shows social media. Going into 2024, I made specific goals for the show and our social media presence, so as we start planning for 2025 I will layout some of what we planned for 2024, how we approached those plans, and how it worked in the end.
Note: this is more of a behind-the-scenes article, not our normal team-oriented content, and isn’t meant to point a finger at anyone by myself. Let me know what you think about this type of content in the comments.
2024 Goal
In order to measure where you finish, you have to define a goal in comparison to where you’re at, right? So I start with a top-line, terminal goal and then defined how to get there (or at least, how I thought we’d get there)
Terminal Goal — Increase show audience to 10% of game-day attendance (I’ll get to why that’s a lofty goal, but let’s talk about how we’d get there.)
Enabling Goal 1 — Increase fan-base awareness
Enabling Goal 2 — Increase Social Media click-through
Enabling Goal 3 — Increase Instagram engagement
Increase show audience to 10% of game-day attendance
I admit this goal was a “stretch goal,” as we call them at my job. To go from less than 100-total listeners per show, to 500 per show seemed impossible, but 10% of a game-day sellout seemed like a reasonable number. I figure I had to set a goal and see if we could reach it. My bonus didn’t depend on reaching the goal or not, so I might as well shoot for a number and see what happens. Unfortunately, I didn’t have good data for 2023 so all I really have is the total views per show for 2023.
In 2023 we averaged about 66 views per show. Caveat- that is views as defined by YouTube, that doesn’t mean someone watched the ~60 minutes in total. In 2023, viewers watched, on average, 15 minutes per show.
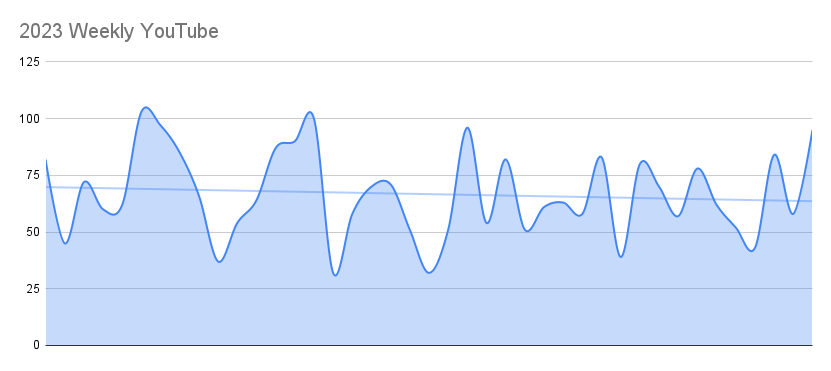
Ending 2024 we saw 42% growth in average listeners (94.98!) and a pretty flat listen-time of about 16 minutes per show. Yes, far short of the 500-average goal, but improvement.
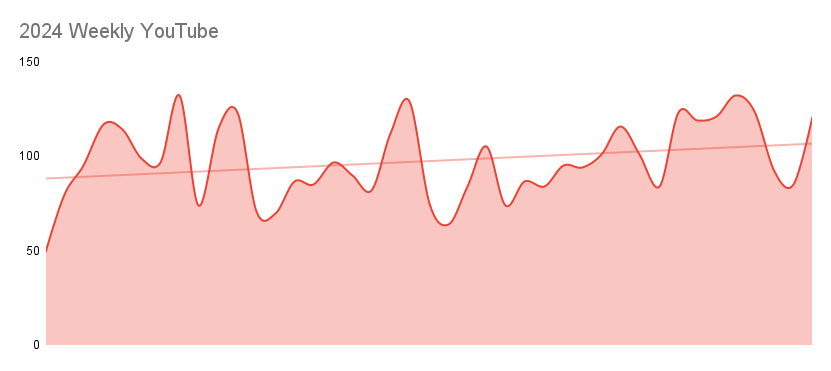

Although we ended well short of my goal, I am encouraged by the listener growth and the rising trendline of average listeners. Even with an up and down season on the field, we still had a rising average through the end of 2024. So I’ll open 2025 with the same goal I had for 2024: average 500 listeners per show. In 2024, I tracked more metrics of our different platforms so I’ll have more of a apples-to-apples comparison than I do for 2023. Check out the next article about Enabling Goal #1.
